ICICI-Prudential-Flexicap-Fund-Growth
Fund Manager : Rajat Chandak | Benchmark : BSE 500 TRI | Category : Equity: Flexi Cap

18.59 -0.08 (-0.43 %)

NAV as on 08-07-2025

1,748.43 Cr

AUM as on 30-05-2025

Rtn ( Since Inception )

16.89%

Inception Date

Jul 07, 2021

Expense Ratio

1.69%

Fund Status

Open Ended Scheme

Min. Investment (Rs)

5,000

Min. Topup (Rs)

1,000

Min. SIP Amount (Rs)

100

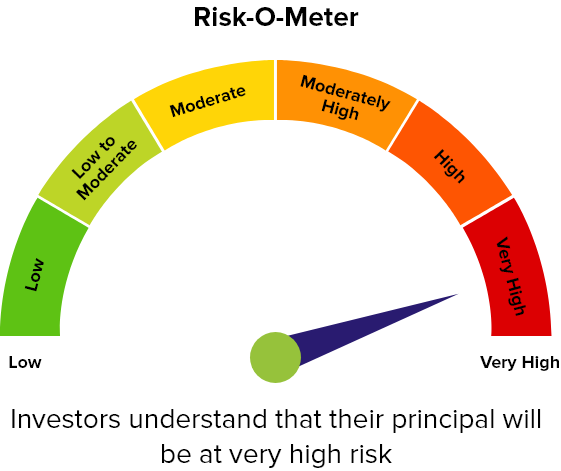
Risk Status

very high

Investment Objective : To generate long-term capital appreciation by investing predominately in equity & equity related instruments across market capitalization.

Returns (%)
1 Mon (%) 3 Mon (%) 6 Mon (%) 1 Yr (%) 3 Yrs (%) 5 Yrs (%) 10 Yrs (%)
Fund 0.98 14.12 2.88 3.51 20.57 0.0 0.0
Benchmark - NIFTY 500 TRI 1.93 15.52 6.64 3.6 20.6 23.09 14.27
Category - Equity: Flexi Cap 1.83 14.67 3.08 2.36 20.01 22.17 13.72
Rank within Category 34 22 23 22 14
Number of Funds within Category 39 39 39 39 29

Returns less than 1 year are in absolute and Returns greater than 1 year period are compounded annualised (CAGR)

Equity Holdings (Top 10)
CompanyHoldings (%)
TVS MOTOR COMPANY LIMITED EQ FV RE.1/-9.7
ICICI BANK LIMITED EQ NEW FV RS. 2/-7.95
MARUTI SUZUKI INDIA LIMITED EQ7.61
AVENUE SUPERMARTS LIMITED EQ5.56
HDFC BANK LIMITED EQ NEW FV RE. 1/-4.66
TREPS3.67
INFOSYS LIMITED EQ FV RS 53.27
ZOMATO LIMITED EQ3.23
PI INDUSTRIES LIMITED EQ NEW FV Re.1/-2.98
ETHOS LIMITED EQ2.8
LARSEN AND TOUBRO LIMITED EQ NEW FV RS.2/-2.68
Azad Engineering Limited2.53
AXIS BANK LIMITED EQ NE FV RS. 2/-2.35
BHARTI AIRTEL LIMITED EQ NEW FV RS 5/-2.26
REDTAPE LIMITED EQ2.24
R R KABEL LIMITED EQ NEW FV RS 5/-2
EICHER MOTORS LIMITED EQ NEW FV RE. 1/-1.93
SAMVARDHANA MOTHERSON INTERNATIONAL LIMITED EQ FV RS. 1/-1.85
STATE BANK OF INDIA EQ NEW RE. 1/-1.83
INTERGLOBE AVIATION LIMITED EQ NEW FV RS. 10/-1.8
SBI LIFE INSURANCE COMPANY LIMITED EQ1.54
PG Electroplast Limited1.53
SUN PHARMACEUTICAL INDUSTRIES LTD. EQ NEW F.V. RE.1/-1.52
SONA BLW PRECISION FORGINGS LIMITED EQ1.43
BRITANNIA INDUSTRIES LIMITED EQ NEW FV RS 11.31
NEULAND LABORATORIES LIMITED EQ1.3
SHARDA MOTOR INDUSTRIES LIMITED EQ NEW FV RS.2/-1.07
SAFARI INDUSTRIES (INDIA) LIMITED EQ NEW FV RS. 2/-1.06
NETWEB TECHNOLOGIES INDIA LIMITED EQ NEW FV RS 2/-0.91
PVR LIMITED EQ0.86
ULTRATECH CEMENT LIMITED EQ0.8
MOTHERSON SUMI WIRING INDIA LIMITED EQ0.76
360 ONE WAM LIMITED EQ NEW FV RE. 1/-0.74
ROLEX RINGS LIMITED EQ0.69
TBO TEK LIMITED EQ NEW FV RE.1/-0.68
Pearl Global Industries Limited0.67
SUNDARAM CLAYTON LIMITED EQ NEW FV RS.5/-0.66
INTERNATIONAL GEMMOLOGICAL INSTITUTE (INDIA) LIMITED0.65
SUNDARAM - CLAYTON LIMITED0.64
SYNGENE INTERNATIONAL LIMITED EQ0.63
APAR INDUSTRIES LIMITED EQ0.61
CUMMINS INDIA LIMITED EQ FV RS.20.57
RATNAMANI METALS AND TUBES LTD EQ NEW RS. 2/-0.54
GREENPANEL INDUSTRIES LIMITED EQ0.53
MAX FINANCIAL SERVICES LIMITED EQ NEW FV RS. 2/-0.52
NAVIN FLUORINE INTERNATIONAL LTD EQ NEW FV RS. 2/-0.49
HCL TECHNOLOGIES LIMITED EQ F.V. RS.2/-0.46
FSN E-COMMERCE VENTURES LIMITED EQ NEW FV RE.1/-0.44
TATA CONSULTANCY SERVICES LIMITED EQ NEW FV RE.1/-0.4
SIEMENS LIMITED EQ NEW FV RS.2/-0.39
CENTURY PLYBOARDS INDIA LIMITED EQ NEW RS.1/-0.33
Sona Blw Precision Forgings Ltd.0.33
Siemens Energy India Limited0.29
BHARAT FORGE LIMITED EQ NEW FV RS. 2/-0.27
MPHASIS LIMITED EQ0.24
CHALET HOTELS LIMITED EQ0.22
SAI SILKS (KALAMANDIR) LIMITED EQ NEW FV RS.2/-0.2
VISHAL MEGA MART PRIVATE LIMITED EQ0.19
Cash Margin - Derivatives0.17
LTIMINDTREE LIMITED EQ0.14
BAJAJ ELECTRICALS LIMITED EQ NEW F.V. RS.2/-0.14
364 Days Treasury Bills0.14
CEIGALL INDIA LTD EQ0.13
C.E. INFO SYSTEMS LIMITED EQ NEW FV RS.2/-0.11
ATHER ENERGY PRIVATE LIMITED EQ FV RE.1/-0.09
G R INFRAPROJECTS LIMITED EQ NEW FV RS. 5/-0.07
91 Days Treasury Bills0.05
91 Days Treasury Bills0.01
Net Current Assets-0.1
Maruti Suzuki India Ltd.-0.35
Show All Holdings
Sector Allocation (%)
Automobile and Auto C...Financial ServicesConsumer ServicesConsumer DurablesCapital GoodsInformation TechnologyChemicalsHealthcareConstructionServices3030242418181212660025.4 %20.25 %10.52 %8.63 %7.57 %5.53 %3.47 %3.45 %2.88 %2.45 %
Asset Allocation
Asset Class Allocation (%)
Equity 96.05
Debt 0.2
Cash & Cash Equivalents 3.74
Derivatives -0.02


Portfolio Behavior
Mean 21.0
Sharpe Ratio 1.16
Alpha 1.21
Beta 0.91
Standard Deviation 13.33
Sortino 1.97
Portfolio Turnover 40
Market Cap Distribution
Large CapMid CapSmall CapOthers80806060404020200064.1 %8.05 %23.9 %3.92 %
Yearly Performance (%)
Created with Highstock 2.1.5ValuesICICI Prudential Flexicap Fund - GrowthNIFTY 500 TRIEquity: Flexi Cap2013201420152016201720182019202020212022
Standard Performance
Scheme
ICICI Pru Flexicap Gr
Benchmark
NIFTY 500 TRI
Additional Benchmark
NIFTY 50 TRI
Category Average
Period Returns Value of
10000 invested
Returns Value of
10000 invested
Returns Value of
10000 invested
Returns Value of
10000 invested
1 Year 3.51 %10,3513.6 %10,3606.21106212.3610236
3 Year 20.57 %17,52820.6 %17,54117.661628920.0117285
5 Year 0.0 %10,00023.09 %28,25720.422532222.1727216
10 Year 0.0 %10,00014.27 %37,96013.183449113.7236172
Since inception 16.89 %10,00012.6 %10,00014.021000016.0110000
Riskometer
riskometer
SIP Returns (Monthly SIP of Rs. 10,000)
3 Year 5 Year 10 Year 15 Year
Scheme Name Invested Amt Current Value XIRR (%) Invested Amt Current Value XIRR (%) Invested Amt Current Value XIRR (%) Invested Amt Current Value XIRR (%)
ICICI Pru Flexicap Gr 360,000 464,008 18.19
NIFTY 500 TRI 360,000 464,206 18.22 600,000 927,056 17.98 1,200,000 2,810,288 16.46 1,800,000 6,171,740 15.14
Equity: Flexi Cap 360,000 461,279 17.65 600,000 917,196 17.41 1,200,000 2,780,053 16.09 1,800,000 6,250,420 15.12

Mutual Fund investments are subject to market risks, read all scheme related documents carefully. Past performance may or may not be sustained in the future. Investors should always invest according to their risk appetite and consult with their mutual fund distributors or financial advisor before investing.