Franklin-India-Flexi-Cap-Fund-IDCW
Fund Manager : R. Janakiraman, Rajasa Kakulavarapu, Sandeep Manam (dedicated for making investments for Foreign Securities) | Benchmark : NIFTY 500 TRI | Category : Equity: Flexi Cap

68.6 0.15 (0.22 %)

NAV as on 04-07-2025

1,867.93 Cr

AUM as on 30-05-2025

Rtn ( Since Inception )

16.7%

Inception Date

Sep 29, 1994

Expense Ratio

1.7%

Fund Status

Open Ended Scheme

Min. Investment (Rs)

5,000

Min. Topup (Rs)

1,000

Min. SIP Amount (Rs)

500

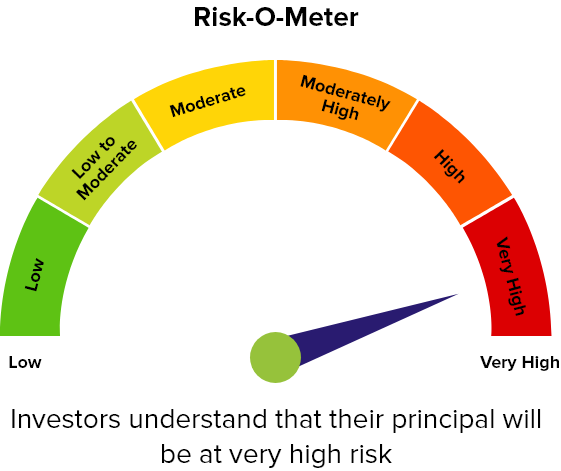
Risk Status

very high

Investment Objective : The investment objective of the scheme is to provide growth of capital plus regular IDCW through a diversified portfolio of equities, fixed income securities and money market instruments.

Returns (%)
1 Mon (%) 3 Mon (%) 6 Mon (%) 1 Yr (%) 3 Yrs (%) 5 Yrs (%) 10 Yrs (%)
Fund 2.61 11.7 1.56 4.75 23.54 25.69 13.48
Benchmark - NIFTY 500 TRI 3.47 13.66 4.35 3.82 21.64 23.3 14.14
Category - Equity: Flexi Cap 3.35 13.05 0.72 2.43 21.17 22.41 13.68
Rank within Category
Number of Funds within Category

Returns less than 1 year are in absolute and Returns greater than 1 year period are compounded annualised (CAGR)

Equity Holdings (Top 10)
CompanyHoldings (%)
HDFC BANK LIMITED EQ NEW FV RE. 1/-8.78
ICICI BANK LIMITED EQ NEW FV RS. 2/-8.44
Call, Cash & Other Assets6.87
BHARTI AIRTEL LIMITED EQ NEW FV RS 5/-4.26
LARSEN AND TOUBRO LIMITED EQ NEW FV RS.2/-4.19
INFOSYS LIMITED EQ FV RS 53.87
AXIS BANK LIMITED EQ NE FV RS. 2/-3.87
RELIANCE INDUSTRIES LIMITED EQ3.18
HCL TECHNOLOGIES LIMITED EQ F.V. RS.2/-3.12
UNITED SPIRITS LIMITED EQ NEW FV RS. 2/-2.81
KOTAK MAHINDRA BANK LIMITED EQ NEW F.V RS.5/-2.7
ZOMATO LIMITED EQ2.58
GRASIM INDUSTRIES LIMITED EQ NEW FV RS. 2/-2.25
APOLLO HOSPITALS ENTERPRISE LIMITED EQ NEW F.V. RS.5/-2.15
TATA MOTORS LIMITED EQ NEW FV RS. 2/-1.93
BHARAT ELECTRONICS LIMITED EQ NEW FV Re 1/-1.93
THE TATA POWER COMPANY LIMITED EQ NEW FV Re.1/-1.9
INTERGLOBE AVIATION LIMITED EQ NEW FV RS. 10/-1.77
NTPC LIMITED EQ1.77
MARICO LIMITED NEW EQ RE.11.57
MAHINDRA AND MAHINDRA LIMITED EQ NEW F.V. RS.51.52
GAIL (INDIA) LIMITED EQ1.5
CIPLA LIMITED EQ NEW FV RS.2/-1.49
PRESTIGE ESTATES PROJECTS LIMITED EQ1.47
STATE BANK OF INDIA EQ NEW RE. 1/-1.47
PB FINTECH LIMITED EQ NEW FV RS. 2/-1.42
CHOLAMANDALAM INVESTMENT AND FIN. CO. LTD EQ NEW FV RS. 2/-1.36
TUBE INVESTMENTS OF INDIA LIMITED EQ1.31
KIRLOSKAR OIL ENGINES LIMITED EQ1.25
INTELLECT DESIGN ARENA LIMITED EQ1.17
KALYAN JEWELLERS INDIA LIMITED EQ1.15
INDUS TOWERS LIMITED EQ1.11
LUPIN LIMITED EQ NEW F.V. RS.2/-1.1
SUN PHARMACEUTICAL INDUSTRIES LTD. EQ NEW F.V. RE.1/-1.05
TRENT LIMITED EQ NEW FV Re. 1/-1.02
ERIS LIFESCIENCES LIMITED EQ NEW FV RE. 1/-0.93
TATA STEEL LIMITED EQ NEW FV RE.1/-0.92
LEMON TREE HOTELS LIMITED EQ0.91
HDFC LIFE INSURANCE COMPANY LIMITED EQ0.91
DEVYANI INTERNATIONAL LIMITED EQ NEW FV Re.1/-0.9
JUBILANT FOODWORKS LIMITED EQ NEW FV RS. 2/-0.82
GODREJ PROPERTIES LIMITED EQ NEW FV RS. 5/-0.81
JYOTHY LABS LIMITED EQ NEW RE. 1/-0.76
THE RAMCO CEMENTS LIMITED EQ NEW RE.1/-0.7
AMARA RAJA BATTERIES LIMITED EQ NEW FV Re.1/-0.62
Hyundai Motor India Ltd0.62
MEDPLUS HEALTH SERVICES LIMITED EQ NEW FV RS.2/-0.59
PI INDUSTRIES LIMITED EQ NEW FV Re.1/-0.51
TEAM LEASE SERVICES LIMITED EQ NEW FV RS. 10/-0.21
JK LAKSHMI CEMENT LIMITED EQ NEW RS.5/-0.17
91 D TBILL MAT- 19/06/250.13
182 Days Treasury Bill 24-JUL-20250.13
Show All Holdings
Sector Allocation (%)
Financial ServicesInformation TechnologyConsumer ServicesHealthcareAutomobile and Auto C...TelecommunicationFast Moving Consumer...Oil, Gas & Consumable...ConstructionPower3535282821211414770028.95 %8.16 %6.82 %6.72 %6 %5.37 %5.14 %4.68 %4.19 %3.67 %
Asset Allocation
Asset Class Allocation (%)
Equity 92.84
Debt 0.26
Cash & Cash Equivalents 6.87


Portfolio Behavior
Mean 20.05
Sharpe Ratio 1.21
Alpha 3.63
Beta 0.91
Standard Deviation 12.16
Sortino 1.97
Portfolio Turnover 24
Market Cap Distribution
Large CapMid CapSmall CapOthers80806060404020200072.32 %12.31 %8.21 %7.13 %
Yearly Performance (%)
Created with Highstock 2.1.5ValuesFranklin India Flexi Cap Fund - IDCWNIFTY 500 TRIEquity: Flexi Cap2013201420152016201720182019202020212022-200204060
Standard Performance
Scheme
Franklin India Flexi Cap IDCW
Benchmark
NIFTY 500 TRI
Additional Benchmark
NIFTY 50 TRI
Category Average
Period Returns Value of
10000 invested
Returns Value of
10000 invested
Returns Value of
10000 invested
Returns Value of
10000 invested
1 Year 4.75 %10,4763.82 %10,3826.04106042.4310243
3 Year 23.54 %18,85521.64 %17,99918.511664521.1717791
5 Year 25.69 %31,37023.3 %28,49920.562547022.4127485
10 Year 13.48 %35,41614.14 %37,53112.973385613.6836045
Since inception 16.7 %6,47,01412.6 %2,46,34114.0134471516.05556441
Riskometer
riskometer
SIP Returns (Monthly SIP of Rs. 10,000)
3 Year 5 Year 10 Year 15 Year
Scheme Name Invested Amt Current Value XIRR (%) Invested Amt Current Value XIRR (%) Invested Amt Current Value XIRR (%) Invested Amt Current Value XIRR (%)
NIFTY 500 TRI 360,000 465,917 18.49 600,000 931,010 18.18 1,200,000 2,810,771 16.47 1,800,000 6,169,321 15.14
Equity: Flexi Cap 360,000 463,242 17.97 600,000 921,240 17.61 1,200,000 2,783,461 16.12 1,800,000 6,253,592 15.13

Mutual Fund investments are subject to market risks, read all scheme related documents carefully. Past performance may or may not be sustained in the future. Investors should always invest according to their risk appetite and consult with their mutual fund distributors or financial advisor before investing.